Gold Fell 25% From Its Record: What AI Gold Price Forecasts Miss
Gold peaked at $5,595.47 in January 2026 and trades near $4,200 today. A look at what AI and machine-learning gold price forecast models actually predict, and what they cannot.
The record everyone quotes is eight months old#
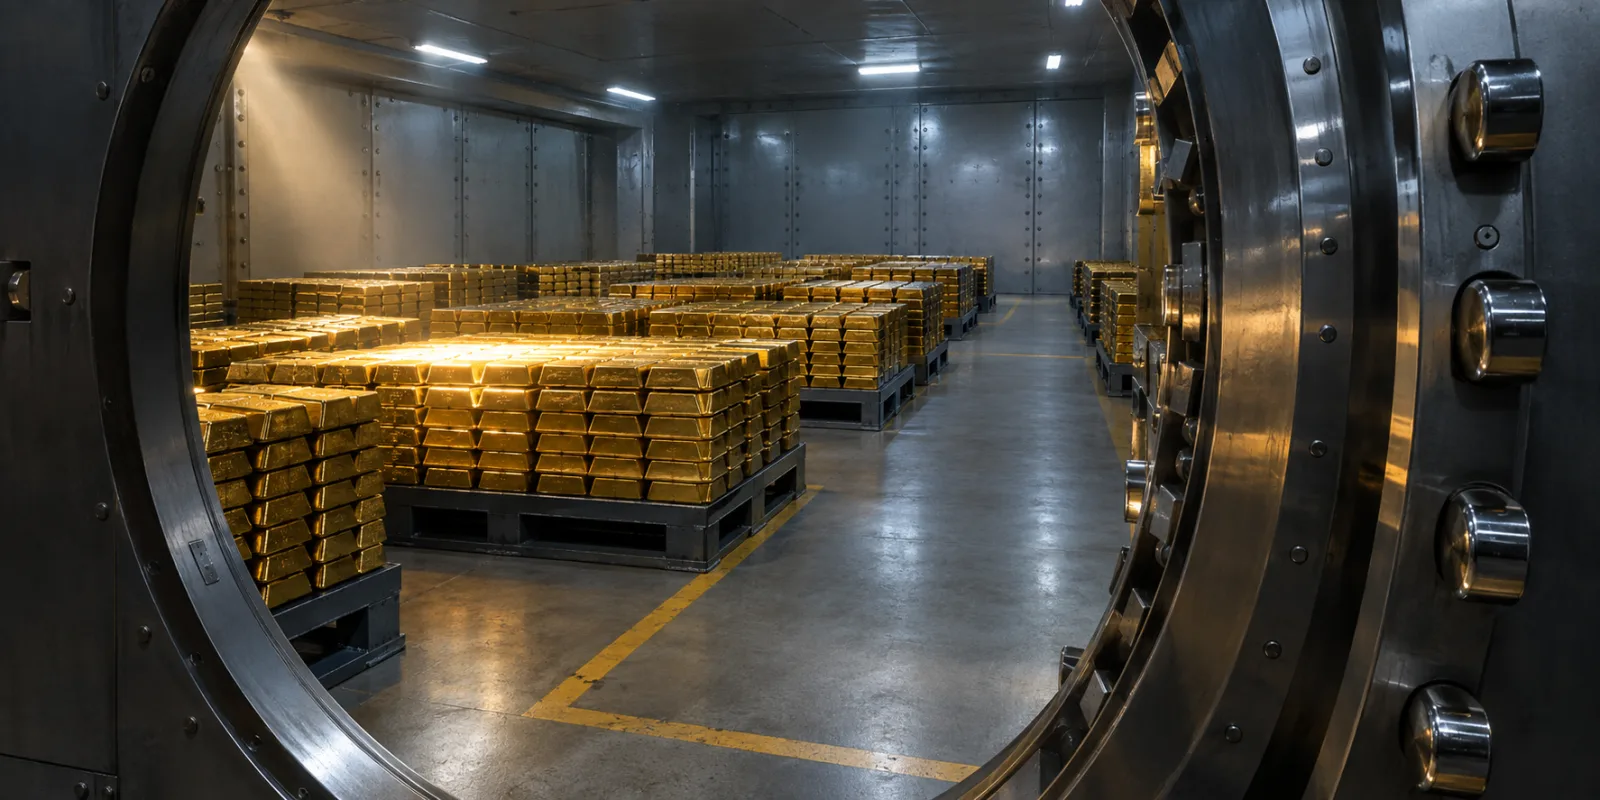
Gold's all-time high was set on 29 January 2026. The World Gold Council puts the intraday peak at $5,595.47 an ounce, and the London benchmark record at $5,405 on the same day. Five months later gold traded at $3,959.33. It was $4,304.83 on 25 September and around $4,197 on 28 September, still about 9.5% above where it stood a year earlier.
So gold is roughly a quarter below its record while remaining one of the better-performing assets of the past twelve months. Both statements are true, which is why headlines about gold have been so confusing this year.
The most recent shove came from the Federal Reserve. On 16 September it raised its target range to 3.75% to 4%, the first increase in more than three years. Gold had been steady near $4,353 an ounce and fell 2.43% that afternoon to $4,247.86.
Almost nobody's model called that sequence. Which raises a fair question about the models now being quoted at you.
What a gold forecasting model actually does#
Three different things get called "forecasting", and mixing them up is how people end up trusting a number they should not.
The first family is statistical pattern-matching, and this is what "AI forecasting" usually means. A neural network is fed years of daily prices and asked to guess tomorrow's. The workhorse is the LSTM, or long short-term memory network, a design that keeps a running memory of recent observations so it can pick up momentum and mean reversion. Cousins include XGBoost and random forests, which build thousands of small decision trees and average them. None of these knows what gold is. They know what the series has tended to do next.
The second family is structural. The World Gold Council's Qaurum tool runs a Gold Valuation Framework that takes a macroeconomic scenario, from Oxford Economics or one you write yourself, works out what jewellery buyers, investors, central banks and miners would do under it, then solves for the return that makes annual supply and demand balance. It answers "if the world looks like this, what price clears the market", not "what will happen".
The third family only looks backwards. The Council's Gold Return Attribution Model splits past returns across economic expansion, risk and uncertainty, the opportunity cost of holding a metal that pays no interest, and momentum. It is a good way to understand why February happened, and it says nothing at all about March.
One more term matters. A random walk is a series whose next move is unrelated to its past ones. If gold behaves like a random walk over a given horizon, today's price is the best available forecast of next year's, and any model claiming better is probably fitting noise. That failure has a name: overfitting, learning the quirks of the training data rather than the pattern.
What the machine-learning papers actually claim#
Read the research rather than the press release and the headline accuracy numbers come with a tight leash.
Saini, Singh and Sinha, writing in Discover Artificial Intelligence in October 2025, tested a hybrid LSTM-autoencoder on daily gold closes from September 2000 to January 2024. It reported an R² of 0.9827 and RMSE of 16.38, well ahead of a plain LSTM. R² is the share of variation the model explains, where 1.0 is perfect. Impressive, until you read the setup: the model takes 30 days of prices and predicts the next day's close. The authors also found that only gold's own price history helped much, with silver weakly associated and crude oil of "comparatively low predictive value". During the volatile stretch of 2020, R² fell to 0.7923.
A December 2025 arXiv paper by Taghipour, Rezaee and Hajati combined two LSTMs through a fusion network tuned by a Gray Wolf Optimizer, using data from 2010 to 2021. Daily mean absolute error came to $0.21, monthly to $22.23. The authors themselves recommend adding "regime-switching or cycle-aware components" to cope with crises, which is a polite way of saying the model assumes the future resembles the sample.
Cohen and Aiche, writing in Chaos, Solitons & Fractals in 2023, compared random forests, gradient-boosted trees and XGBoost. XGBoost won. Its most useful inputs were one-day-lagged equity indices, US and Japanese bond yields, and the VIX volatility index. Again, a one-day horizon.
Interpretation: the published machine-learning literature on gold is overwhelmingly about tomorrow, occasionally about next month, and essentially never about next year. When a website shows you an "AI prediction" for 2027 to two decimal places, it is not doing what these papers do.
Where machine learning has a better record is spotting stress rather than pricing it. Research summarised by the Centre for Economic Policy Research found random forests could forecast tail risk in Treasury, FX and money markets up to twelve months out, and recurrent neural networks could flag market dysfunction up to 60 working days ahead. The same write-up notes the neural network missed the COVID shock entirely, because its cause sat outside the financial system. That is the limit worth remembering, because a model can only learn from events that have already been recorded.
What the structural models say about the next six months#
The Council's mid-year outlook, published with gold down 7% for the year to date, is unusually specific. Under the macro consensus of roughly 2.9% global growth, cooling inflation and limited rate rises, its framework has gold trading within 5% of $4,100 an ounce through the second half. A weaker economy or a geopolitical shock points to $4,500 or above. A consolidation case runs 5% to 15% lower, with a technical support level around $3,860.
The same document notes something worth holding onto: historically, once gold has fallen more than 20% from a high, the average full drawdown has reached about 36%. Gold is currently around 25% below January's peak. That is a statement about past episodes, not a prediction, and the sample of such episodes is small.
The framework also publishes its own sensitivities, which is more than most forecasters do.
| Input change | Modelled effect on the gold price |
|---|---|
| Central bank buying 20t to 30t above trend | about +1% |
| US 10-year yield falls 25 basis points | about +1.75% |
| CPI inflation 1 percentage point higher | about +0.5% |
| Geopolitical risk index up 100 points in a month | about +2.5% |
| India raises gold import duty by 10 points | about -2% |
Source: World Gold Council, Gold Mid-Year Outlook 2026. All figures are the Council's own estimates, all else held equal.
The humans with models kept revising towards the price#
If models were driving the forecasts, published targets would move less than the spot price. They have not.
| Forecast | Made | Number | Where gold actually went |
|---|---|---|---|
| LBMA analyst survey, 2026 average | Jan 2026, 28 analysts | $4,741.97, range $3,450 to $7,150, with 22 of 28 expecting a print above $5,000 | Average for January to July came in at $4,595.75 |
| LBMA snapshot survey | Jul 2026, 16 analysts | Year-end near $4,500, full-year average $4,604, top call $5,100, lowest $3,879 | Around $4,200 in late September |
| Goldman Sachs, year-end 2026 | Raised to $5,400 on 23 Jan 2026 from $4,900 | Back to $4,900 by 28 Aug 2026 | Gold peaked in January and fell |
| J.P. Morgan Research, Q4 2026 | 9 Jun 2026: $6,000, cut from $6,300 in February | 2027 average trimmed to $6,263 from $6,550 | Still roughly $1,800 above the late-September price |
The LBMA's own commentary on the July snapshot said the revisions showed expectations had "come into line with the reality of the first seven months". Interpretation, but hard to avoid: the forecasts followed the price rather than leading it. That is not a scandal. Analysts update on news like everyone else. It is a reason to treat any single number as a view held on a particular Tuesday.
The five inputs every model is really arguing about#
Whatever the architecture, forecasters disagree about the same handful of assumptions.
Interest rates come first. The Fed's own projections put the median federal funds rate at 4.1% at the end of 2026 and unchanged through 2027. Gold pays no income, so a higher risk-free rate raises the cost of holding it.
Central bank demand is the second. Official buyers took 289 tonnes in the second quarter, five times the revised 57 tonnes of the first, led by Poland at 51 tonnes and China at 33. First-half net demand of 345 tonnes was still the weakest since 2022. Goldman Sachs assumes purchases average about 50 tonnes a month in 2026 against 17 tonnes before 2022. Change that assumption and the whole forecast moves.
Exchange-traded fund flows are the third and the most volatile. August brought $18 billion in, lifting holdings 121 tonnes to a record 4,189 tonnes and assets under management to $615 billion. Gold rose 13.3% that month, its third-best monthly return in 25 years, then gave much of it back in September. Momentum cuts both ways, and the machine-learning models are largely momentum detectors.
Fourth is physical demand, where policy can bite hard. India raised its gold import duty from 6% to 15% in early April, the steepest rise on record. The Council expects Indian jewellery plus bar and coin demand to fall by 50 to 60 tonnes, roughly 10% lower than the previous year.
Fifth is the residual that no model handles: the event outside the sample. Five of the sixteen analysts in the LBMA's July survey named Iran as their main concern. A model trained on price history cannot price a decision that has not been taken.
Key takeaways#
- Gold's record was $5,595.47 intraday on 29 January 2026. It traded near $4,200 in late September, roughly a quarter lower, yet still about 9.5% above a year earlier.
- Published machine-learning models for gold forecast one day ahead, sometimes one month. Their reported accuracy does not transfer to annual targets, and one paper's R² fell from 0.98 to 0.79 in a volatile year.
- The World Gold Council's structural framework has gold within 5% of $4,100 through the second half under consensus macro assumptions, with $4,500 or more if conditions deteriorate.
- Bank and analyst targets were cut repeatedly through 2026, from $5,400 to $4,900 at Goldman Sachs and from $6,300 to $6,000 at J.P. Morgan for the fourth quarter. Forecasts tracked the price.
- The assumptions that move any gold forecast most are the policy rate path, central bank buying, ETF flows, Indian physical demand after the duty rise, and geopolitical shocks that no model can anticipate.
Frequently asked questions#
Can an AI model tell me whether gold goes up next year? Not on the evidence available. The peer-reviewed models predict the next day's close from recent prices, and their authors say they need extra machinery to survive regime changes. Annual targets in circulation come from analysts making judgement calls, often assisted by models, not from models alone.
Why did gold fall when the Federal Reserve raised rates? Gold generates no income, so its appeal depends partly on what safe interest-bearing assets pay. When the Fed lifted its range to 3.75% to 4% on 16 September, holding gold became relatively more expensive and the price fell 2.43% that afternoon.
If gold is down 25%, is that unusual? Drawdowns of this size have happened before. The World Gold Council notes that past falls exceeding 20% averaged around 36% in total depth. Whether this one follows that pattern is unknown, and the number of comparable episodes is small.
Why do banks keep changing their targets? Because their inputs change. A rate rise, a month of record ETF inflows or a slowdown in official buying each shift the arithmetic. A target is a snapshot of assumptions, not a commitment.
Does central bank buying put a floor under the price? It provides support rather than a floor. The Council estimates each 20 to 30 tonnes of demand above trend is associated with roughly 1% of upward pressure. Official demand in the first half of 2026 was the weakest since 2022.
What does India's duty increase mean for a buyer in India? Higher landed cost. Duty went from 6% to 15%, though local physical prices initially rose only 4% to 6% and traded at a discount to official prices, which widened from about $14 to nearly $150 an ounce after the announcement.
Should I buy, sell or wait? This article makes no recommendation and none of the sources cited here does either. What the evidence supports is narrower: treat precise long-horizon price predictions, however they were generated, as opinions with error bars nobody is showing you.
Glossary#
LSTM (long short-term memory): a neural network built to handle sequences, which keeps a memory of recent values so it can learn patterns such as momentum. The most common architecture in published gold-price research.
XGBoost: a method that builds many small decision trees in sequence, each correcting the last. Frequently the best performer on financial tables of data.
R²: the proportion of variation in the target that a model explains, from 0 to 1. A high R² on next-day prices is easier to achieve than it sounds, because tomorrow's price is usually close to today's.
Out-of-sample testing: checking a model on data it never saw during training. Without it, reported accuracy means little.
Overfitting: learning the noise in the training data rather than the underlying relationship. The model looks excellent in testing and fails in use.
Random walk: a series whose next change is independent of previous ones. If prices behave this way over a horizon, the current price is the best forecast for that horizon.
Regime shift: a change in how a market behaves, such as a move from falling to rising interest rates. Models trained before the shift tend to break after it.
Drawdown: the fall from a peak to a subsequent low, expressed as a percentage.
This is reporting, not investment advice. Figures attributed to named sources are facts as those sources published them. Sentences that weigh those figures are interpretation, and are labelled.
References#
- World Gold Council, Gold Mid-Year Outlook 2026: Point break (intraday record of $5,595.47 on 29 January 2026, June low of $3,959.33, H2 scenarios and price sensitivities, drawdown history).
- World Gold Council, Gold Market Commentary: Paved with good interventions, August 2026 (August close of $4,563, 13.3% monthly return, $5,405 benchmark record).
- World Gold Council, Gold ETF flows, published 9 September 2026 (August inflows of $18bn, holdings of 4,189 tonnes, $615bn assets under management).
- World Gold Council, Gold Demand Trends Q2 2026: Central Banks (289 tonnes in Q2, 345 tonnes in H1, buyer breakdown).
- World Gold Council, India gold market update: import tightening (duty raised from 6% to 15%, expected demand impact, local price discount).
- World Gold Council, Qaurum and the Gold Valuation Framework (scenario-based valuation methodology).
- World Gold Council, Gold Return Attribution Model (factor groups used to decompose past returns).
- London Bullion Market Association, 2026 Precious Metals Forecast Survey, at a glance (January average forecast of $4,741.97, forecast range, analyst count).
- Kitco News, LBMA snapshot survey predicts gold price average near $4,500/oz by year-end, 12 August 2026, reporting LBMA survey data (July snapshot figures, actual January to July average of $4,595.75).
- Goldman Sachs, Gold is forecast to climb as central banks buy the precious metal, 28 August 2026 (year-end forecast of $4,900, central bank buying assumptions).
- TheStreet, Goldman Sachs quietly revamps gold price target for 2026, January 2026 (target raised to $5,400 from $4,900 on 23 January 2026).
- J.P. Morgan Global Research, Gold price predictions for 2026 and 2027, 9 June 2026 (Q4 2026 target of $6,000 cut from $6,300, 2027 average of $6,263 cut from $6,550).
- Investing News Network, Gold price drops below US$4,300 as Fed hikes rates, September 2026 (FOMC decision of 16 September 2026, gold's intraday reaction, Fed median rate projections).
- Trading Economics, Gold price, 28 September 2026 (spot price of about $4,197 and 12-month change).
- Forbes Advisor, Gold price today, 25 September 2026 (spot price of $4,304.83 and 52-week range).
- Agampreet Saini, Rahul Kumar Singh and Puneet Sinha, Forecasting gold price using hybrid deep neural network LSTM-autoencoder, Discover Artificial Intelligence, volume 5, published online 22 October 2025 (accuracy metrics, 30-day input window, next-day target, 2020 performance).
- Hesam Taghipour, Alireza Rezaee and Farshid Hajati, Gold price prediction using long short-term memory and multi-layer perceptron with Gray Wolf Optimizer, arXiv, 30 December 2025 (error metrics, data period, stated need for regime-switching components).
- Gil Cohen and Avishay Aiche, Forecasting gold price using machine learning methodologies, Chaos, Solitons & Fractals, October 2023 (model comparison, most influential predictors).
- Centre for Economic Policy Research, How AI can help detect warning signs of financial market stress (random forest and recurrent neural network results, failure to anticipate the COVID shock).