De-Dollarisation Is Real, and Far Slower Than the Headlines Claim
The dollar's share of global payments, reserves and currency trading, checked against SWIFT, IMF, BIS and ECB data. What is actually shifting, and what is just a price move.

Why this fortnight is a good moment to check the numbers#
Every few months someone announces that the dollar's reign is over. This month the trigger was the BRICS summit in New Delhi on 12 and 13 September, where leaders adopted a declaration backing further work on "promoting trade settlements and investments using BRICS local currencies", according to the text published by the Indian Prime Minister's Office. Within a day the familiar claims were circulating again: the petrodollar is finished, a BRICS currency is coming, the dollar collapse is booked in.
Then the data arrived. SWIFT's Global Currency Tracker published in August 2026 put the dollar at 50.99% of the international payments it tracks, with the renminbi fifth on 3.10%. The IMF's most recent reserve figures show the dollar's share going up, not down. And the Bank for International Settlements found the dollar on one side of 89.2% of every currency trade in the world.
So the story is not that de-dollarisation is fake. It is that the shift is concentrated in places most coverage never looks at, and is almost invisible in the numbers people quote loudest.
What the word actually means#
The dollar does four separate jobs, and "de-dollarisation" gets used for all of them at once.
It is a reserve asset. Central banks hold foreign currency so they can defend their own exchange rate and pay for imports in a crisis. The IMF tracks this in a quarterly database called COFER, short for Currency Composition of Official Foreign Exchange Reserves.
It is a settlement currency. When a Vietnamese exporter is paid by a German buyer, the money usually moves through correspondent banks in dollars. SWIFT, the messaging network those banks use, publishes the currency split of the payment instructions it carries.
It is an invoicing currency. Oil, copper, shipping freight and much manufactured trade are priced in dollars even when neither party is American. The Federal Reserve's 2025 review of the dollar's international role put the dollar's share of export invoicing at about 74% in Asia-Pacific and 79% across the rest of the world outside Europe and the Americas.
And it is a funding currency. Governments and companies outside the United States borrow in dollars because that is where the deepest pool of lenders sits.
A country can move away from one of these and stay firmly attached to the other three. Russia settles almost all of its China trade in roubles and yuan, yet the oil underneath those contracts is still priced off dollar benchmarks. Treating the four as one number is how a slow, uneven process gets reported as a collapse.
What the payment data shows#
Here is where the four measures stood at their most recent readings.
| Measure of dollar use | Latest reading | Source and date |
|---|---|---|
| Share of international payments tracked by SWIFT | 50.99% | SWIFT Global Currency Tracker, August 2026 |
| Same, excluding payments inside the eurozone | 59.58% | SWIFT, August 2026 |
| Share of allocated official foreign exchange reserves | 57.13% | IMF COFER, Q1 2026 |
| Share of global currency trading (dollar on one side) | 89.2% | BIS Triennial Survey, April 2025 |
| Share of trade-finance letters of credit | 79.86% | SWIFT, August 2026 |
The 51% payment figure is the one that travels furthest, and it is the weakest of the five. SWIFT's headline series counts payments inside the eurozone, where the euro obviously wins by default. Strip those out, as SWIFT does in a separate table, and the dollar is at 59.58% against 13.36% for the euro. On that basis the renminbi slips to 2.34% and sixth place, behind sterling, the yen and the Canadian dollar.
Trade finance is a better guide to what exporters trust, because a letter of credit is a bank's promise to pay a stranger in another jurisdiction. There the dollar takes 79.86%, with the renminbi second on 8.43% and the euro third.
Currency trading tells the same story more bluntly. The BIS runs a survey of dealers every three years, and its April 2025 round recorded $9.6 trillion of turnover a day, up 28% on 2022. The dollar's share of that activity rose from 88.4% to 89.2%. Sterling fell from 12.9% to 10.2%. The renminbi climbed to 8.5% and is now the fifth most traded currency in the world, which is a genuine change, but it is a change happening around the dollar rather than at its expense.
The reserve numbers are mostly a currency-market story#
The reserve share is where most of the confusion lives. The dollar was above 70% of allocated reserves in the late 1990s and is near 58% today, a decline Linda Goldberg of the New York Fed and Oliver Hannaoui set out in May 2026. That much is not in dispute.
What the drop means is. Reserve shares are reported at market prices, so when the dollar weakens against the euro and the yen, the dollar slice of every portfolio shrinks even if no central bank has sold a single bond. The IMF made the point with unusual precision after the second quarter of 2025, when the unadjusted dollar share fell 1.47 percentage points to 56.32%. Holding exchange rates constant, the IMF calculated that the share was 57.67% and that currency movements explained roughly 92% of the fall. The euro's apparent gain that quarter vanished entirely once adjusted.
Goldberg and Hannaoui go further. Looking at 69 countries between 2015 and 2020, they find the net contribution of actual changes in portfolio preference was "essentially a wash". Much of the headline decline came from arithmetic: Switzerland piling up enormous non-dollar reserves, and Russia shifting its own portfolio. Few countries were quietly selling dollars.
The most recent reading cuts against the narrative outright. IMF COFER for the first quarter of 2026, published on 1 July, shows the dollar at 57.13% of $13.10 trillion in allocated reserves, up from 56.42% three months earlier. The IMF attributes roughly half of that increase to exchange rate effects rather than fresh buying, which cuts both ways: valuation flatters the dollar in a strong quarter exactly as it punishes it in a weak one. The euro was 20.03%, the yen 5.44% and the renminbi 1.99%. After more than a decade of talk about reserve diversification, the renminbi is still not holding two dollars in every hundred.
Where de-dollarisation is genuinely happening#
Three places, all of them narrower than the headlines and all of them real.
The first is China's own plumbing. The People's Bank of China reported cross-border renminbi receipts and payments of RMB 35 trillion in the first half of 2025, up 14% year on year, with the renminbi covering 28% of China's cross-border goods trade settlement. The clearing system behind that, CIPS, had 1,791 participating institutions by the first quarter of 2026 and average daily value of roughly RMB 920 billion in March, according to analysis of CIPS disclosures by FXC Intelligence. SWIFT still connects more than 11,000 institutions.
The second is sanctioned and semi-sanctioned trade. Russian and Chinese officials say more than 99% of their bilateral trade now settles in roubles and yuan. That is complete de-dollarisation in one corridor, driven by exclusion rather than preference. Elsewhere the experiments remain small. The Atlantic Council's Dollar Dominance Monitor records cumulative volume of $55.49 billion on mBridge, the central bank digital currency bridge, by November 2025. Global currency markets turn over more than that in a few minutes.
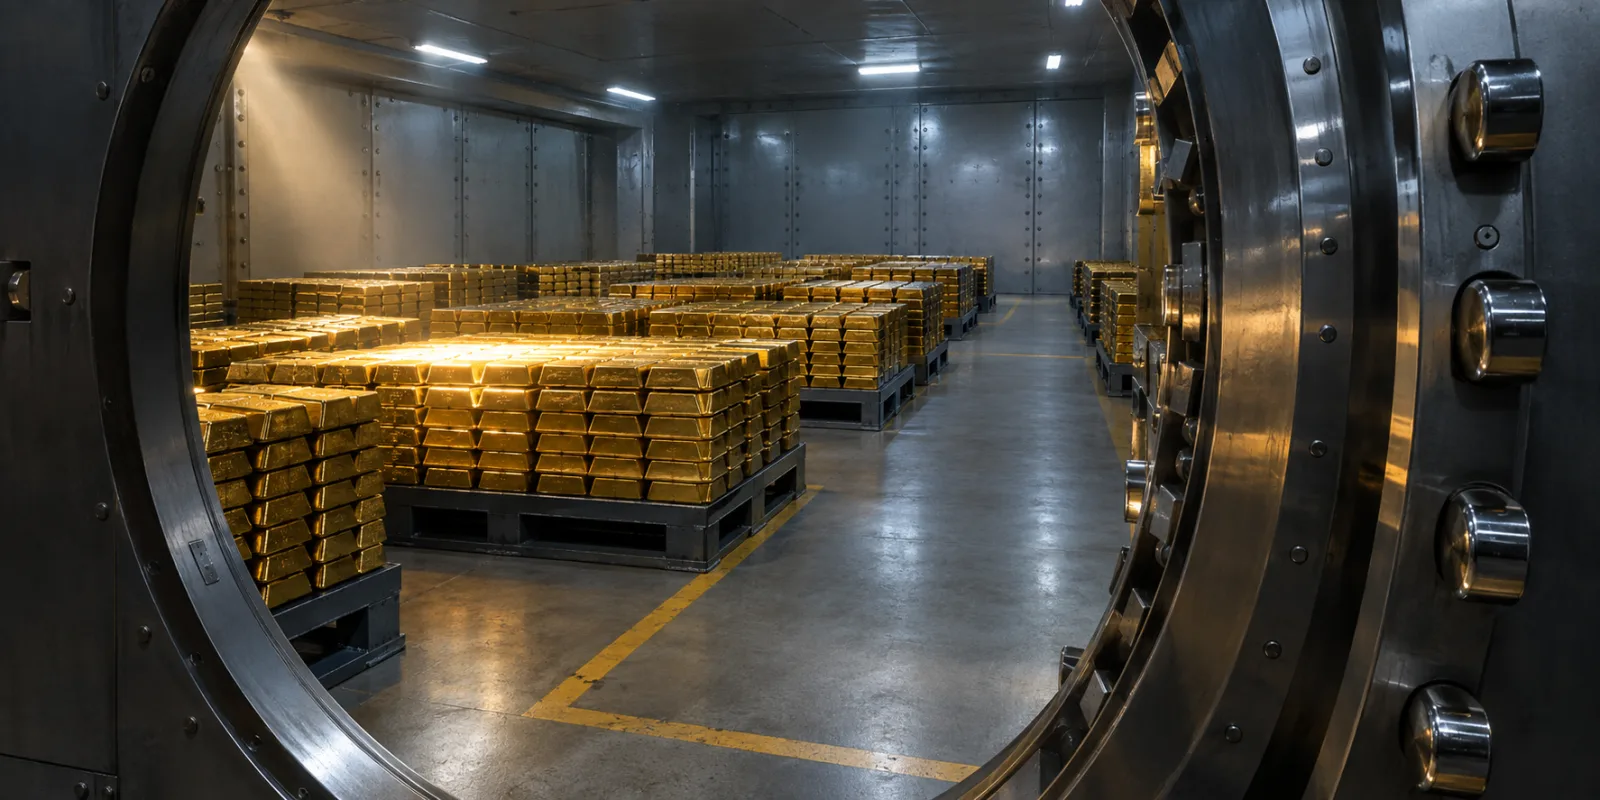
The third is gold, and it is the clearest signal of the three. Measured at market prices, the European Central Bank found that gold made up about 27% of global official reserves at the end of 2025, ahead of both the euro at 15% and US Treasury securities at 22%. Part of that is simply the roughly 60% rise in the gold price during 2025. But intent shows up in survey work too: in the World Gold Council's 2026 central bank survey of 76 institutions, 89% expected global central bank gold holdings to rise over the following year, a record 45% expected their own to rise, and 74% expected a lower dollar share of global reserves within five years.
That last figure is the honest summary of the debate. Reserve managers do expect the dollar to lose ground. They are buying insurance rather than switching currencies.
What this means if you are not a central bank#
For a salaried saver or a small exporter, three practical points follow from the data rather than from the rhetoric.
Pricing power has not moved. If you import components or sell software abroad, your invoice is still most likely denominated in dollars, and your margin still moves with the dollar exchange rate. Nothing in the 2026 data changes the case for hedging that exposure if it is large relative to your business.
Alternatives exist but are thin. Settling in renminbi or rupees can cut conversion costs in specific corridors, and Indian exporters can invoice in rupees through the special rupee vostro accounts the Reserve Bank of India set out in its trade-settlement framework. Those are useful tools for particular counterparties, not a general replacement for dollar clearing.
And foreign demand for dollar assets has not disappeared. The US Treasury's July 2026 capital flows release, published on 16 September, recorded a net inflow of $83.7 billion across all categories, including a $38.8 billion increase in foreign holdings of Treasury bills. People predicting a buyers' strike have been predicting it for a long time.
None of this is investment advice, and none of it rules out a faster shift later. The dollar's position rests on deep capital markets, open accounts and legal predictability, and those are policy choices rather than laws of nature. What the evidence supports today is a slow erosion at the edges, not a handover.
Key takeaways#
- The dollar took 50.99% of SWIFT-tracked international payments in August 2026, but 59.58% once payments inside the eurozone are excluded. The lower number is the one usually quoted.
- Its share of allocated official reserves rose to 57.13% in the first quarter of 2026, from 56.42% three months before, with about half of that move down to exchange rates.
- Most of the long-running decline in reserve share reflects exchange rate moves and the behaviour of a handful of large holders, not broad selling of dollars.
- Real de-dollarisation is concentrated in China's domestic clearing system, in sanctioned trade corridors, and in central bank gold buying.
- The dollar's share of global currency trading rose between 2022 and 2025, to 89.2%. Trading and invoicing are far stickier than reserves.
Frequently asked questions#
Is the dollar about to collapse? Nothing in the current data points that way. Its share of currency trading rose in the latest BIS survey, its reserve share rose in the latest IMF release, and foreign investors were net buyers of Treasury bills in July 2026. A slow decline in reserve share is a different phenomenon from a collapse.
Is there a BRICS currency? No. The New Delhi Declaration adopted on 12 September 2026 refers to settling trade in members' existing national currencies and to making payment systems interoperable. It does not create a common currency, and it does not use the word de-dollarisation.
Why do SWIFT and IMF figures disagree? They measure different things. SWIFT counts payment messages sent over its network. COFER counts the currency mix of central bank reserve portfolios. A currency can be widely used for payments and lightly held as a reserve, or the reverse.
Does SWIFT capture everything? No, and this matters. Payments cleared inside China's CIPS system, netted between branches of the same bank, or settled through regional systems do not appear. As renminbi payment infrastructure grows, SWIFT will understate renminbi use by a widening margin.
Has the petrodollar ended? Some oil is now sold for non-dollar currencies, particularly between Russia, China and India. Global oil benchmarks are still quoted in dollars, and the dollar remains on one side of nearly nine in ten currency trades, which is the deeper dependency.
Is gold replacing the dollar in reserves? Gold overtook the euro and US Treasuries as a share of global official reserves at market prices at the end of 2025, largely because the price rose about 60% that year. Central banks are also buying more of it. Gold pays no interest and cannot settle a trade invoice, so it complements reserve currencies rather than replacing them.
What should I watch next? The quarterly IMF COFER release, the exchange-rate-adjusted version of the dollar share rather than the headline, and the renminbi's share of trade finance in SWIFT's monthly tracker, currently 8.43%.
Glossary#
Allocated reserves. The portion of official foreign exchange reserves whose currency composition is disclosed to the IMF. Some countries, notably China, report less detail, so global shares are estimates based on the disclosed pool.
COFER. The IMF's quarterly database on the currency composition of official foreign exchange reserves, published roughly three months after each quarter ends.
Correspondent banking. The arrangement under which a bank in one country holds an account with a bank in another so it can make payments there. Most cross-border dollar payments route through a handful of large US correspondents.
CIPS. The Cross-Border Interbank Payment System, China's clearing network for renminbi payments. It handles the settlement that SWIFT only messages about.
Letter of credit. A bank guarantee that an exporter will be paid once shipping documents are presented. The currency chosen shows which money the parties trust in a dispute.
Valuation effect. The change in a portfolio's reported currency shares caused purely by exchange rate movements, with no buying or selling involved.
mBridge. A shared platform built by several central banks for settling cross-border payments in digital versions of their currencies.
Special rupee vostro account. An account an overseas bank holds with an Indian bank to settle trade in rupees instead of dollars.
References#
- Swift, Global Currency Tracker, August 2026
- International Monetary Fund, COFER data brief, 1 July 2026 (2026Q1)
- International Monetary Fund, Dollar's Share of Reserves Held Steady in Second Quarter When Adjusted for FX Moves, 1 October 2025
- Bank for International Settlements, OTC foreign exchange turnover in April 2025, Triennial Central Bank Survey
- Board of Governors of the Federal Reserve System, The International Role of the U.S. Dollar, 2025 Edition, 18 July 2025
- European Central Bank, The international role of the euro, June 2026 and accompanying press release, 2 June 2026
- Linda S. Goldberg and Oliver Hannaoui, The dollar's status through the lens of foreign exchange reserves, CEPR VoxEU, 15 May 2026, based on New York Fed Staff Report 1087
- People's Bank of China, Deepened Financial Reform and Opening-up Foster RMB's Rising Global Status, 17 October 2025
- World Gold Council, Central Bank Gold Reserves Survey 2026
- Atlantic Council GeoEconomics Center, Dollar Dominance Monitor, updated 9 March 2026
- Prime Minister's Office, Government of India, BRICS New Delhi Declaration, 12 September 2026
- US Department of the Treasury, Treasury International Capital Data for July 2026, 16 September 2026
- FXC Intelligence, CIPS volumes rise as China expands payments infrastructure, May 2026
- Anadolu Agency, Russia, China conduct over 99% of trade in national currencies, says official
- Reserve Bank of India, International Trade Settlement in Indian Rupees (INR): FAQs