Silver's squeeze story: why the gold-silver ratio beats the price headline
Silver has halved since January yet the gold-silver ratio sits near 67, close to its long-run range. Here is what the ratio measures, what London's lease rates and vault data show, and why the 2026 silver deficit is smaller than the headlines suggest.
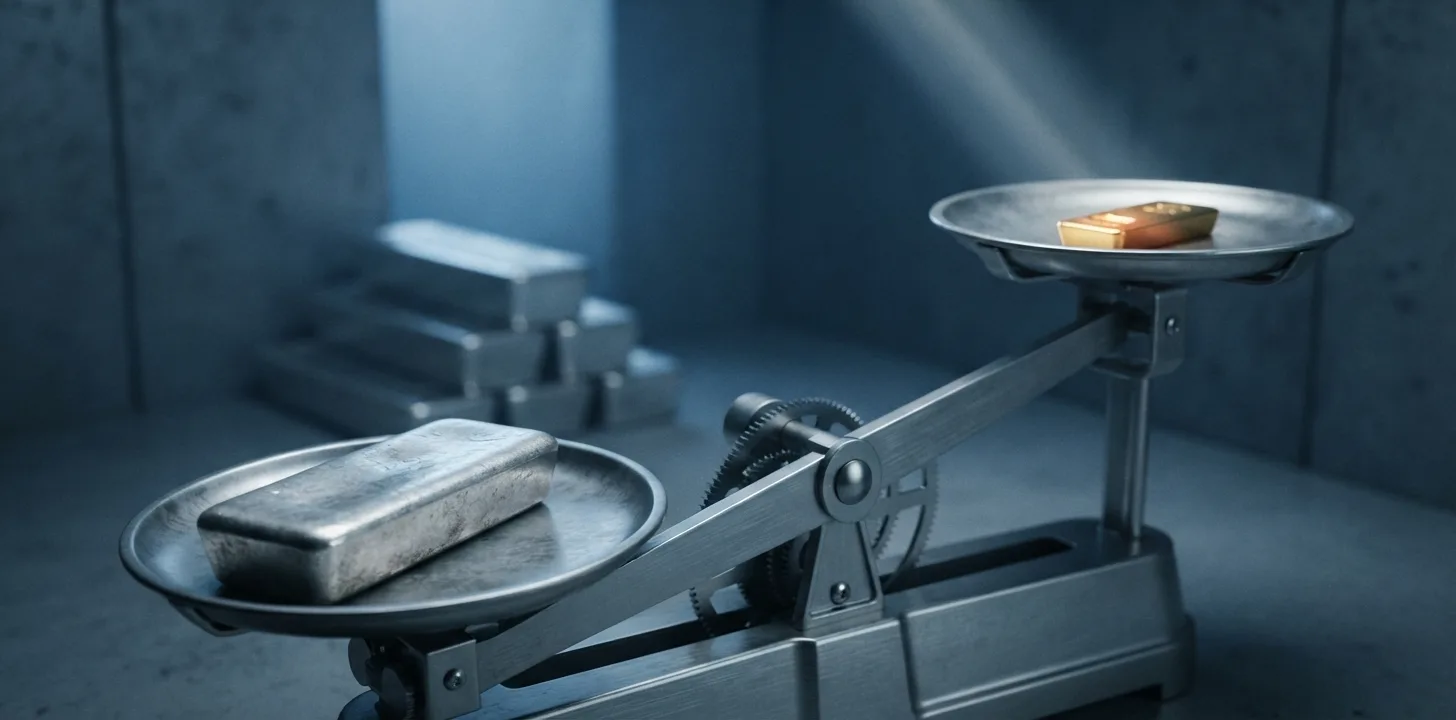
Silver has halved, and almost nothing has changed#
Silver closed on 28 September at $61.53 an ounce, and gold at $4,148.69, according to the daily market report from USAGOLD. Both fell hard that day, silver by 4.3 per cent, after President Trump rejected Iran's proposal to reopen the Strait of Hormuz and Brent crude rebounded towards $106.
Read silver's price on its own and you would think the market had broken. Its all-time high was $121.67, set on 29 January 2026. Eight months later it trades at roughly half that.
Now divide one metal by the other. Gold at $4,148.69 against silver at $61.53 gives a gold-silver ratio of 67.4. That number sits inside the range precious metals have occupied for most of the past two decades. Measured against a year ago rather than against January, silver is still up about 30 per cent.
Two numbers, one market, completely different stories. The price says crash. The ratio says silver gave back a spike that was never going to hold and is now priced roughly where it usually is against gold. If you own silver, or are thinking about buying some, the second number is the more useful one.
What the gold-silver ratio actually measures#
The ratio is simple arithmetic: how many ounces of silver it takes to buy one ounce of gold. At 67.4, a gold coin costs the same as 67.4 silver coins of equal weight. Nothing else is baked in.
Its usefulness comes from what it strips out. Both metals are priced in dollars, so both move when the dollar moves or when real interest rates shift. Dividing one by the other cancels most of that shared noise and leaves the part that is specific to silver.
Silver differs from gold in one respect that drives everything else: it has two customers. Roughly 58 per cent of demand last year was industrial fabrication, 657.4 million ounces of it, according to the Silver Institute: solar panels, electrical contacts, brazing alloys, the silver paste inside circuit boards. Most of that metal is consumed and never comes back. Gold, by contrast, is mostly hoarded. Almost everything ever mined still exists in a vault or around someone's neck.
That mix makes silver behave like a small industrial commodity with a monetary option attached. It also makes it violent. Silver's market is a fraction of gold's in value, so the same flow of money moves it much further, in both directions. When investors pile in, the ratio falls fast. When they leave, it rises fast.
The 2026 round trip#
Here is where the ratio has been.
| Period | Gold-silver ratio | What was happening |
|---|---|---|
| 1900s to 1930s | 30:1 to 40:1 | Classical gold standard |
| 1940s to 1971 | 30:1 to 35:1 | Bretton Woods fixed the gold price |
| January 1980 | about 17:1 | Hunt brothers' silver corner, the modern low |
| April 2011 | about 32:1 | Silver approached $50 |
| March 2020 | about 125:1 | Covid panic, the modern record high |
| Before the 2025 rally | about 105:1 | Silver's cheapest recent reading against gold |
| Mid-January 2026 | briefly below 50:1 | A 14-year low as silver passed $90 |
| Late January 2026 | below 45:1 | Silver's $121.67 peak |
| 28 September 2026 | 67.4:1 | Gold $4,148.69, silver $61.53 |
| Second half of 2026 | about 70:1 | J.P. Morgan's forecast, not an observed level |
| Average since 1900 | 50:1 to 60:1 | For reference |
| Recent decades | 60:1 to 75:1 | For reference |
Sources: USAGOLD's ratio guide for the readings up to 2011 and the averages; TradingKey for the 105 reading and the sub-50 break in January; J.P. Morgan Global Research for the sub-45 late-January low and the second-half forecast; USAGOLD's daily report for 28 September. The March 2020 record and the 1980 low are calculated from daily spot prices.
The shape of that journey matters more than any single row. Silver went from historically cheap against gold to historically expensive in about twelve months, then handed most of it back. J.P. Morgan's Global Research team describes the move since as normalisation and expects the ratio to sit around 70 in the second half of 2026 and near 75 in 2027.
Note what that implies. A ratio of 75 with gold unchanged would put silver near $55. The bank forecasts silver averaging $70.60 an ounce in 2026 and $63.90 in 2027, down from an earlier 2026 estimate of $84.30. That is a forecast, not a fact, and forecasts of this kind have been revised repeatedly this year.
Where the squeeze came from, and where it went#
Last autumn's squeeze was not about mining. It was about the specific bars sitting in specific London vaults.
Most wholesale silver changes hands over the counter in London, cleared against metal held in LBMA-approved vaults. A large share of that metal is already owned by exchange-traded products and cannot be lent or sold by the banks that store it. What is left is called the free float, and it is the only silver actually available to settle trades.
By the end of September 2025 the free float had fallen to roughly 136 million ounces, a record reported low. London's daily over-the-counter turnover averaged around 450 million ounces in 2025. The float was worth less than a third of a single day's trading.
What happens next is mechanical. Anyone who needs physical silver in London has to borrow it, and the cost of borrowing is the lease rate. In normal conditions it runs below 1 per cent a year. In October 2025 it hit about 39 per cent, among the highest on record. The Silver Institute's own account of the period calls it an "unprecedented liquidity squeeze".
Then the metal moved, as high prices generally persuade it to. Lease rates were back to roughly 2 to 3 per cent by the middle of the first quarter of 2026. London vault holdings, which had dropped to 27,065 tonnes in February, stood at 28,431 tonnes at the end of August 2026, up 0.77 per cent on the previous month, according to the LBMA. J.P. Morgan attributes much of this year's price weakness to exactly that: physical market tightness unwinding from stretched levels.
So the squeeze was real, and it ended the way squeezes usually end. Ratios near 45 were pricing a shortage of borrowable metal in one city, not a shortage of silver on earth.
The deficit is real, and smaller than the story#
Silver has run a structural deficit since 2021, meaning demand has exceeded new supply from mines and recycling every year. That part is not in dispute.
The size is where perspective helps. The Silver Institute's World Silver Survey 2026, published on 15 April, forecasts a sixth consecutive deficit of 46.3 million ounces in 2026, widening from 40.3 million ounces in 2025. Total demand for 2026 is put at 1.11 billion ounces. The gap is about 4 per cent of annual consumption, covered from stocks that already exist above ground.
Two details rarely survive the headline. First, the forecast has shrunk. In February the same organisation projected a 67 million ounce deficit for 2026. By April that had come down to 46.3 million.
Second, high prices are destroying demand. Industrial use is expected to fall 3 per cent to 639.6 million ounces, a second consecutive annual drop, with solar consumption down 19 per cent as manufacturers substitute away from silver. J.P. Morgan's Gregory Shearer goes further, seeing potential for solar demand to fall by around 30 per cent this year, roughly 60 million ounces. Data centres, electrification and electric vehicles are growing, but not fast enough to offset panels.
Mine supply, meanwhile, is close to inelastic. Most silver is a by-product of copper, lead and zinc mines, so a higher silver price does not reliably bring on more of it. Production was 846.6 million ounces in 2025, up 3 per cent, and is expected to stay broadly flat.
The honest summary is a tight market that is getting less tight in the short run for two reasons: buyers are using less, and stocks have been rebuilt.
What the ratio can and cannot tell a small buyer#
The ratio is a relative-value gauge, not a timing signal. At 125 in March 2020 it said silver was historically cheap against gold, and silver went on to outperform for years. At 45 in January it said the opposite, and it was right within weeks. Both readings were extreme. At 67.4 it says very little, which is itself information: the easy relative call has gone.
Three practical points get lost in ratio arithmetic.
Costs are not symmetric. Buying $5,000 of silver means handling roughly 80 ounces of metal against about 1.2 ounces of gold. Dealer premiums, postage, insurance and storage are all charged on bulk, so the same money buys proportionally less metal in silver. In the United Kingdom, HMRC's VAT exemption applies to investment gold and not to other bullion, so silver attracts the standard 20 per cent rate. That is a fixed handicap before any ratio argument begins.
Positioning has already deflated. The CFTC's Commitments of Traders report for 22 September 2026 shows non-commercial traders holding 34,701 long and 9,257 short COMEX silver contracts, a net long of 25,444 contracts against total open interest of 106,474. That is a modest speculative bet by recent standards, and it cuts both ways: less froth to unwind, less fuel for a squeeze.
The macro backdrop is hostile to metals that pay nothing. The Federal Reserve raised its target range to 3.75 to 4.00 per cent on 16 September, and markets now price roughly a 70 per cent probability of another rise in October, on CME FedWatch pricing. Shearer's point is the plain one: higher Fed rates increase the opportunity cost of holding a non-yielding asset like silver.
Where the Silver Institute's analysts do land firmly is on volatility rather than direction. Their judgement is that the market has entered an era of reduced stocks, that tightness will not be constant, but that liquidity will generally be thinner, lease rates more volatile and price moves larger than investors have grown used to. On that reading, another 2025-style dislocation is less a forecast than a standing possibility.
None of this is advice on whether to buy. It is the set of numbers worth checking first.
Key takeaways#
- Silver has fallen from $121.67 in January to $61.53 on 28 September, yet the gold-silver ratio of 67.4 sits inside its normal recent range of 60 to 75. The ratio unwound; the metal did not break.
- The 2025 squeeze was a London liquidity event. The free float hit a record low near 136 million ounces and lease rates reached about 39 per cent against a normal sub-1 per cent.
- That tightness has eased. Lease rates fell back to 2 to 3 per cent, and London vault holdings recovered to 28,431 tonnes by the end of August 2026.
- The 2026 deficit of 46.3 million ounces is about 4 per cent of annual demand, and the forecast was cut from 67 million ounces between February and April.
- High prices are cutting demand faster than they are raising supply. Industrial use is set to fall 3 per cent, with solar down 19 per cent, while mine output stays flat because most silver is a mining by-product.
Frequently asked questions#
What is a normal gold-silver ratio? There is no official figure. Averaged since 1900 it lands between 50 and 60, while recent decades point more towards 60 to 75, according to USAGOLD's ratio guide. The modern extremes are about 17 in January 1980 and about 125 in March 2020.
Does a high ratio mean I should buy silver? It means silver is cheap relative to gold at that moment, which is not the same as cheap. The ratio has spent long stretches far from its average and gives no indication of when it will revert. This is information, not a recommendation, and nothing here is investment advice.
Is the silver shortage real? The deficit is real and documented: 2026 is the sixth consecutive year, at 46.3 million ounces on the Silver Institute's April forecast. Whether that constitutes a shortage is interpretation. It equals roughly 4 per cent of annual demand and is being met from existing above-ground stocks.
Why did silver fall so much faster than gold this year? Silver's market is far smaller in value than gold's and more than half its demand is industrial. Investment flows move it further, and slowing solar and electronics demand hits it in a way that does not apply to gold.
What should I watch for the next squeeze? Silver lease rates and the London free float, both derived from LBMA vault data, published monthly on the fifth business day. Lease rates rising above a few per cent, alongside a falling float, is what preceded October 2025.
Are silver coins and bars the cheapest way to hold it? Not usually, once premiums, storage and tax are counted. In the UK, the VAT exemption covers investment gold but not silver, which therefore carries the standard 20 per cent rate at the point of purchase. Exchange-traded products avoid VAT and storage costs but you hold a claim rather than the metal. Each involves different risks, and the right answer depends on circumstances a general article cannot see.
Glossary#
Gold-silver ratio. The number of ounces of silver needed to buy one ounce of gold. At 67.4, one ounce of gold costs the same as 67.4 ounces of silver.
Free float. The silver in London vaults that is genuinely available to settle trades, after subtracting metal already owned by exchange-traded products and other long-term holders.
Lease rate. The annualised cost of borrowing physical metal for a set period. It is the clearest market-based signal of physical scarcity, because it rises when nobody wants to part with their bars.
Structural deficit. A year in which total demand exceeds mine production plus recycling, with the gap filled from existing above-ground stocks rather than new metal.
Industrial fabrication. Silver consumed in manufacturing, including solar panels, electrical contacts, brazing alloys and electronics. Most of it is never recovered.
By-product mining. Metal produced as a secondary output of a mine built for something else. Most silver comes from copper, lead and zinc operations, which is why a higher silver price does not reliably increase supply.
Thrifting. Redesigning a product to use less of an expensive input. Solar manufacturers have steadily reduced the silver content of each panel.
Commitments of Traders report. The weekly CFTC publication showing how many futures contracts each category of trader holds. It is the standard measure of speculative positioning in COMEX silver.
References#
- The Silver Institute, World Silver Survey 2026, published 15 April 2026
- The Silver Institute, Elevated lease rates, regional liquidity tightness and robust investor interest resulted in record silver prices in 2025, 15 April 2026
- The Silver Institute, Global silver investment to remain strong in 2026 against the backdrop of a sixth consecutive annual market deficit, 10 February 2026
- LBMA, London vault data, holdings as at end August 2026
- CFTC, Commitments of Traders, COMEX futures only, 22 September 2026
- Federal Reserve, FOMC statement, 16 September 2026
- J.P. Morgan Global Research, Silver price forecast for 2026 and 2027
- Investing News Network, Silver Institute: sustained supply deficit exposes market to squeezes
- Kitco News, Silver market faces another deficit in 2026 as volatility and investment demand shape outlook, 15 April 2026
- Kitco, Silver spot price and all-time high, accessed 29 September 2026
- USAGOLD, Daily precious metals market report, 28 September 2026
- USAGOLD, Gold-silver ratio guide
- FXEmpire, London's silver is running out of room, 23 April 2026
- TradingKey, Gold-silver ratio falls below 50 for the first time in 14 years, 16 January 2026
- HMRC, VAT rates on goods and services
- HMRC, VAT Gold manual VGOLD1300: background to the exemption for investment gold
- Trading Economics, Silver spot price, accessed 29 September 2026
This article is for information only and is not investment, tax or legal advice. Figures are accurate as of the dates cited.